GPS-RTK experiments: real-life application with a hydrogen car
This section details how to capture the data and reproduce the results obtained, as presented in the thesis of this research project.
A video illustrating our experimentations is available on this YouTube link.
Two setups are installed in the car, with the two receivers spaced along the 3 axes of 90 / 60 / 30 cm.
Experimentation procedure with ROS 2
To run and view the experiment with our system and ROS 2, follow these steps. First, to replay the recorded data, go to the folder containing the bag files codes/bag_files/experiments_hydrogen_car and run in a terminal, for example: ros2 bag play rosbag2_2024_03_25-15_02_16_neighborhood_loria. In another terminal, for the RViz2 display with map, gps trace and position, we have: ros2 launch display_rviz2_pckg display.launch.py. To choose which map to display, you can modify the parameter name_map in the launch with the correct map name. Finally, in a third terminal, to have a frame representing the center of the gps, and be able to follow its movements more easily in RViz2: ros2 launch human_pckg human.launch.py human\_ns:=human\_1. In this launch file, you need to comment out all the nodes except the one we’re interested in, the human_gps_frame_broadcaster.
Note
When capturing the data, and visualizing it with the human_pckg package frame, the name of the agent displayed is human_1, but it could be called something else. We can consider it’s the human co-driver in the car we’re tracking, with the antenna on the roof above his head.
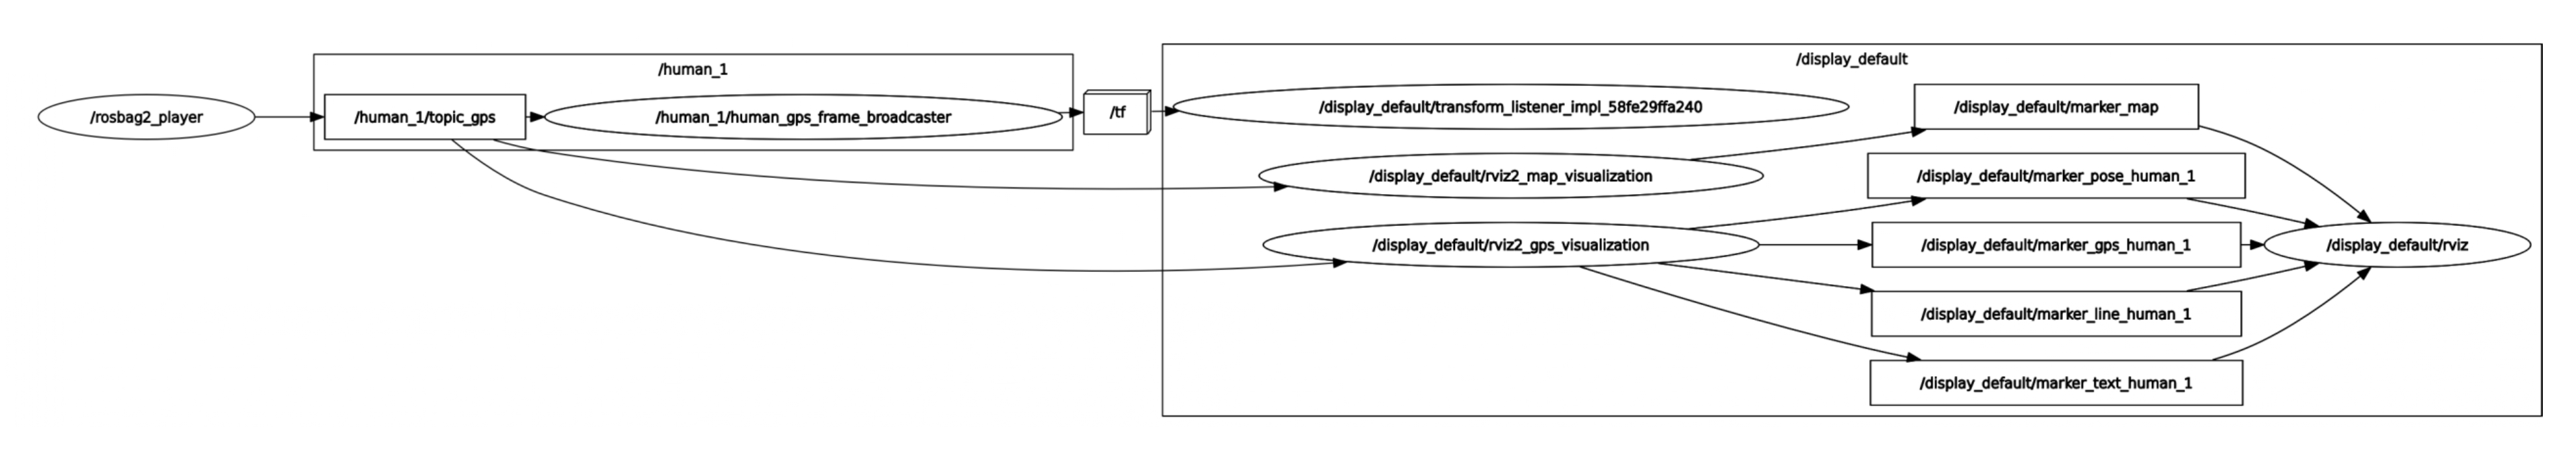
Node graph for replaying data, display the car’s reference frame (human_1) and the GPS map in RViz2.
Plots from pos files
The RTK corrector can save log files in pos format. Everything is configurable in the firmware. Once the files have been recorded, you can use Emlid Studio software to visualize the results. Alternatively, we have made available a Python file codes/bag_files/experiments_hydrogen_car/generate_plot_map.py, which uses the data to plot the car’s displacement curve on a map. After execution, the generated file plot_track_map.html can be opened with your browser.
We create also a file codes/bag_files/experiments_hydrogen_car/gps_sol_status_and_distance.py, wich is a node ROS 2 to display the type of solution for the two GPS units, and their relative distances. The distance between the two GPS during the two experiements isn’t really good, because of the inside GPS. But we can have the percentage of type of solution.
Data and registered bag files
All the data from the experiments carried out with the two set-ups are in the codes/bag_files/experiments_hydrogen_car folder. It contains the bag files of our first set-up with our solution under ROS 2 and the antenna on the roof, but also the log files in pos format of the second set-up.
rosbag2_2024_03_25-15_02_16_neighborhood_loria: bag file for a drive in a small residential area.rosbag2_2024_03_25-15_36_15_city_tour_Nancy_20min: bag file for a drive in an urban and suburban area.GNSSM2_raw_20240325135850.pos: contains positions in LLH format of the path in a small residential area.GNSSM2_raw_20240325143439.pos: contains positions in LLH format for the drive in urban and suburban area.