RViz2 package: system observer via ROS 2
To visualize the various data from our system as an observer, we have created a display_rviz2_pckg package. It consists of a launch file, and two nodes to display and visualize in RViz2 the RTK GPS of each agent, as well as a map of the local area.

Graphical representation of our RViz2 display system. Here we use the default value of the namespace and the agent with RTK GPS.
Launch file
As a system observer, this launch file src/display_rviz2_pckg/launch/display.launch.py can be used to launch rviz2, rviz2mapvisualization and rviz2gpsvisualization. The default name of the namespace is display_default.
- display.launch.generate_launch_description()
Launch nodes : rviz2, rviz2_map_visualization and rviz2_gps_visualization.
GPS display
We recommend using this rviz2_gps_visualization node with a launch file, because to run directly, you need to pass an ROS 2 argument in the form of a list of character strings, which is not trivial.
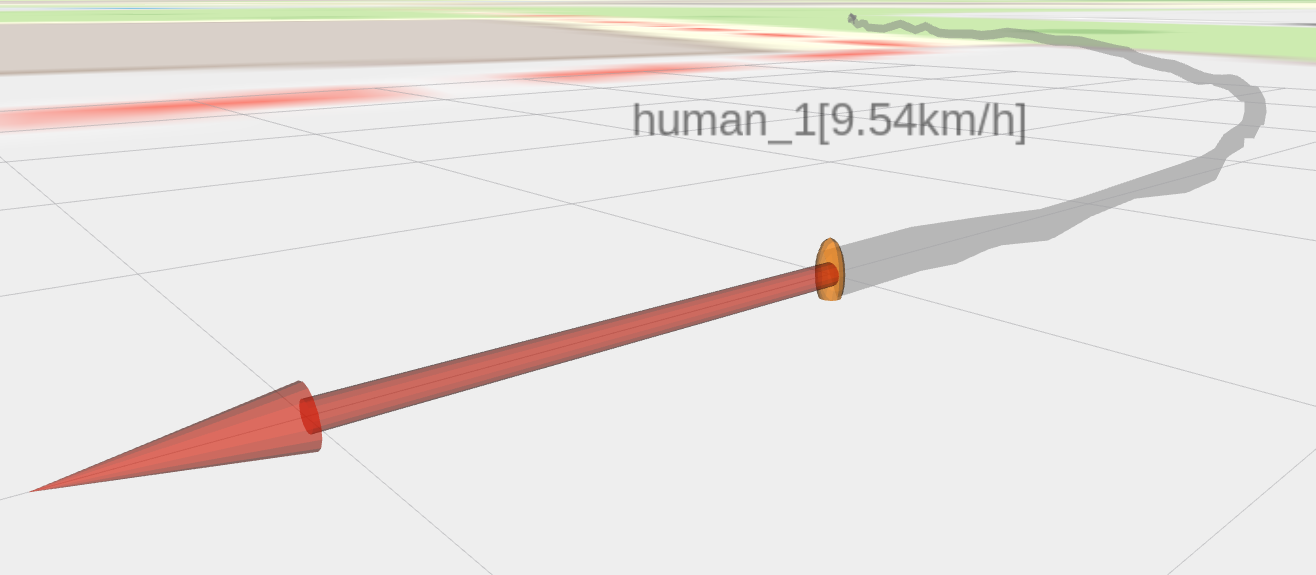
Our 3D representation of an RTK GPS in RViz2 in real time.
Note
All our 4 publishers are in the same callback, so execution time is higher, but remains reasonable for display (5 ms). So, there’s no need to make multiple separate nodes in parallel.
List of our objects displayed in RViz2 for RTK GPS human_1. Each object in the rviz node subscribes to a published topic.
We use the rviz2_gps_visualization node from the display_rviz2_pckg package:
- class Rviz2GpsVisualization
Bases:
rclpy.node.NodeClass of rviz2_gps_visualization node.
Initialization
Constructor taking a dynamic parameter ROS 2 for agent names in the system using RTK GPS.
- Parameters:
agents_name (list[str]) – [ROS 2 param] List of agent names in the system, equipped with RTK GPS, defaults to [‘’]
- listener_callback(msg_gps_rcv, topic_name)
Subscriber collecting the various GPS data, to create 4 publishers for RViz2.
All our 4 publishers are in the same callback, so execution time is higher, but remains reasonable for display (5 ms). So there’s no need to make multiple separate nodes in parallel.
- Parameters:
msg_gps_rcv – Message received in SatMsgRcv format
topic_name (str) – Name of our current subscriber’s topic, allowing us to publish in the correct publishers
- Returns:
None
Tip: Create several publishers from the same callback
In this node we use a tip, we’re going to use the partial function in the functools library to pass a callback listener with a different topic name as a subscriber parameter: this will identify which agent the method corresponds to.
Map display
To achieve this mapping, different maps exist linked to APIs such as Google Maps, BingMaps, plotly, however this requires an API key and/or authentication. We’re going to use a map under a free license: OpenStreetMap. If the area of operation is known or even approximate, you can download the map directly from OpenStreetMap and then work offline. If you’re working in an unknown area, you can automate map retrieval.
Note
In addition of OpenStreetMap, there are geographic information systems (GIS) free to create, edit, visualize, analyze and publish geospatial data, as QGIS.
For the 3D object, a COLLADA file format is used, with extension .dae. The physical object is 1 metre by 1 metre in size, centred at zero, and of zero thickness. La texture déposée dessus est donc déformée. Il faut maintenant redimensionner l’objet grâce à la bibliothèque geographiclib.geodesic et sa focntion geod.Inverse.
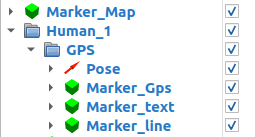
Representation of the 3D map object in Blender, with a side length of 1 meter and a thickness of zero.
The idea is to have a single object display_rviz2_pckg/images/object_map.dae, and only change its texture map.png according to the map selected. The old texture will be deleted, then the new image will be copied and renamed map.png. This saves us having to create a map object for each tile.
We use the rviz2_map_visualization node from the display_rviz2_pckg package:
- class Rviz2MapVisualization
Bases:
rclpy.node.NodeClass of rviz2_map_visualization node.
Initialization
Constructor taking a dynamic parameter ROS 2 for agent names in the system using RTK GPS.
- Parameters:
name_map (str) – [ROS 2 param] Name of the map you wish to display, defaults to ‘map_plaine’
reference_agent_name (str) – [ROS 2 param] Name of one agent of the system, to calculate the position of our map in 3D space, defaults to ‘human_1’
antenna_height (float) – [ROS 2 param] If you want t ouse your own RTK base as origin and fix the altitude of the map, defaults to 0.065
- listener_gps_for_publish_map(msg_gps_rcv)
Subscriber to the GPS data of one agent, calculate the position of the local map, and publish the marker.
- Parameters:
msg_gps_rcv – Message received in SatMsgRcv format
- Returns:
None
- select_coordinate_map(name)
Function to find out the dimensions of the selected tile.
Format for adding a map: ‘name_map’: [top latitude, left longitude, bottom latitude, right longitude]
- Parameters:
name (str) – Name of the selected map
- Returns:
Coordinates of the four sides of the selected map
- Return type:
list[float]
Alternatives: map display without RViz2
Once the map and its coordinates have been retrieved, several libraries are available to handle map display. However, not all of them are capable of real-time display (Cartopy, Folium, GeoPandas), and they also require JavaScript display, which is not necessarily necessary (Leaflet, mapboxgl). We will use Matplotlib which works with a number of user interface toolkits (wxpython, tkinter, qt, gtk, and macosx). Here are a few tips on how to create a real-time display with Matplotlib.
In Matplotlib, the draw (and draw_idle) function is not required with ion: This is used to update a figure that has been altered, but not automatically re-drawn. If interactive mode is on (via ion()), this should be only rarely needed, but there may be ways to modify the state of a figure without marking it as stale. Draw is equivalent to calling fig.canvas.draw_idle(), where fig is the current figure.
Blender for 3D objects
Note
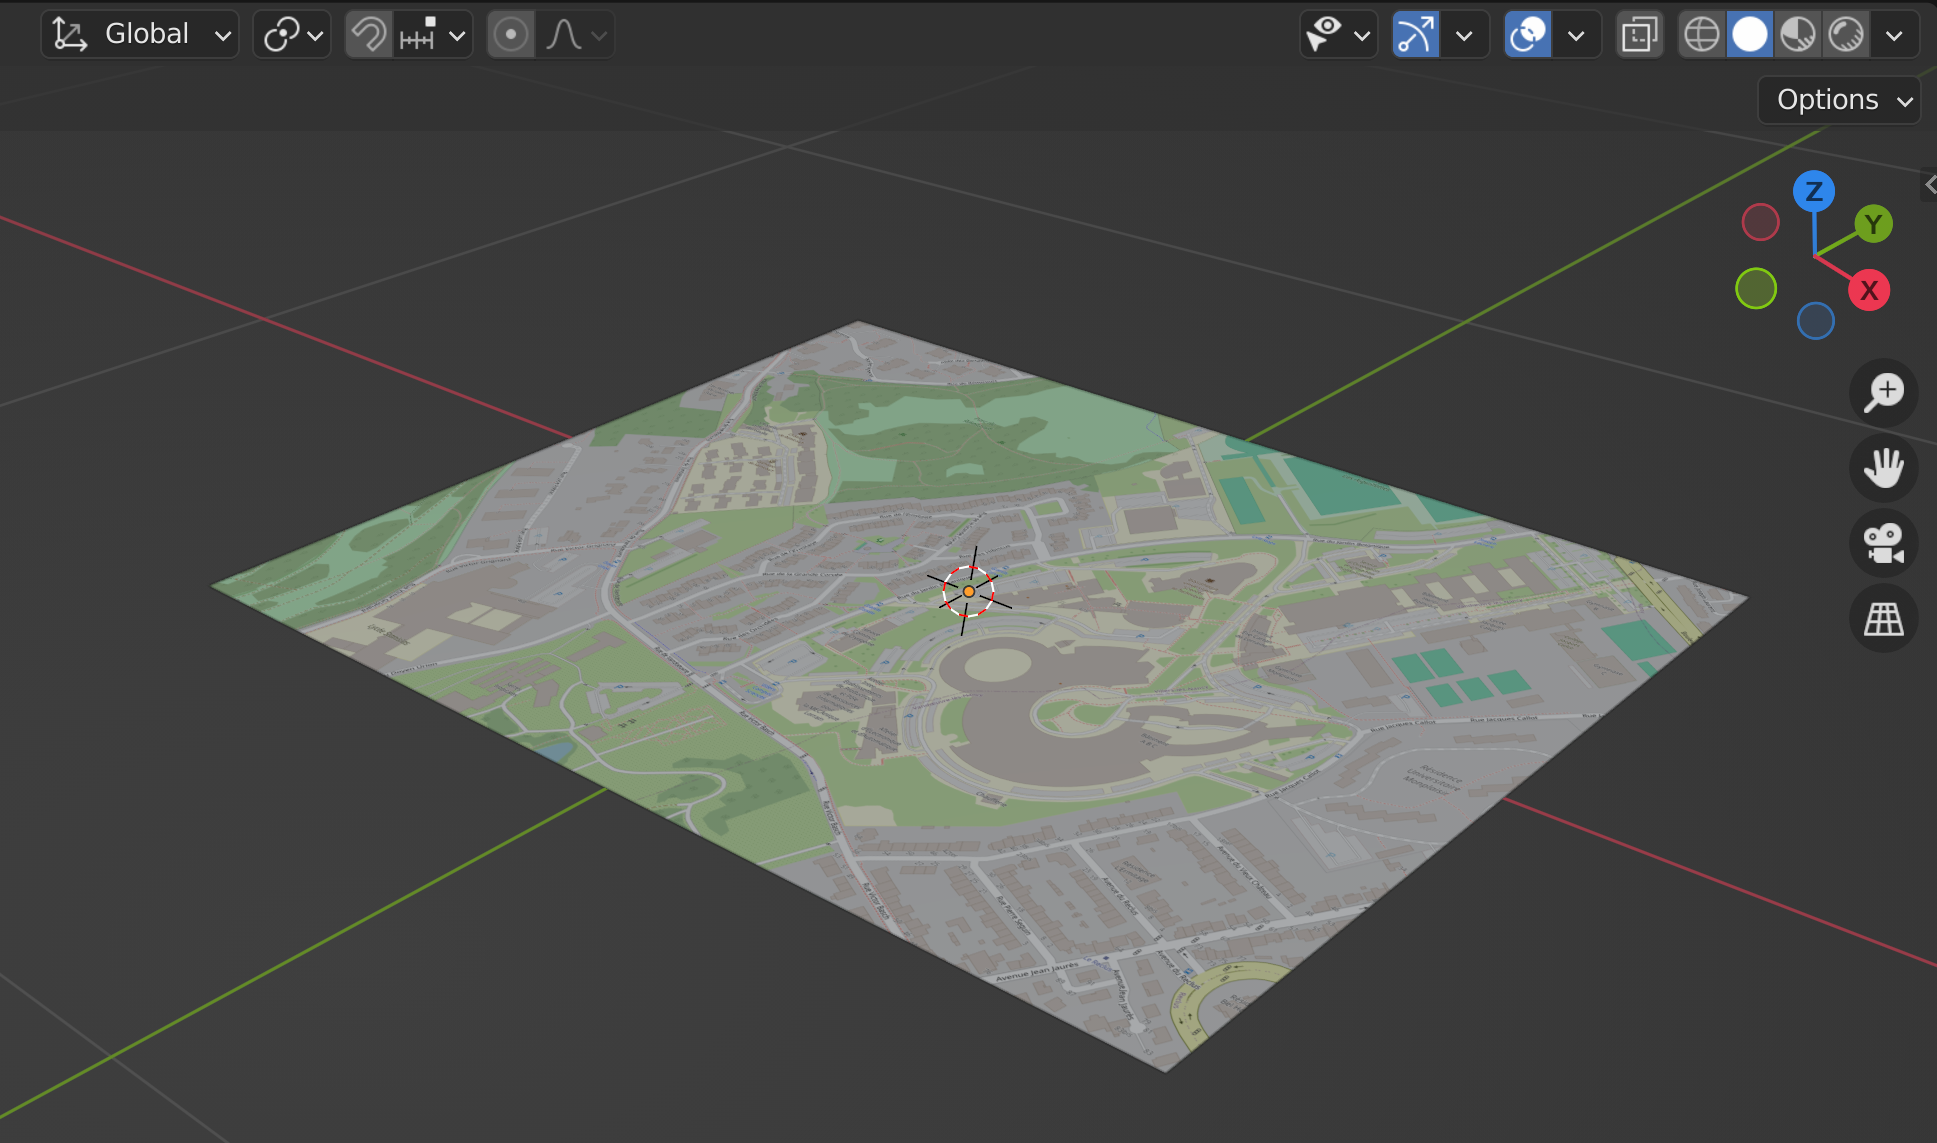
To display the textures of an object in Blender, such as an image on a surface, click on shading, then on color, and select texture.
Menu for displaying textures in Blender.
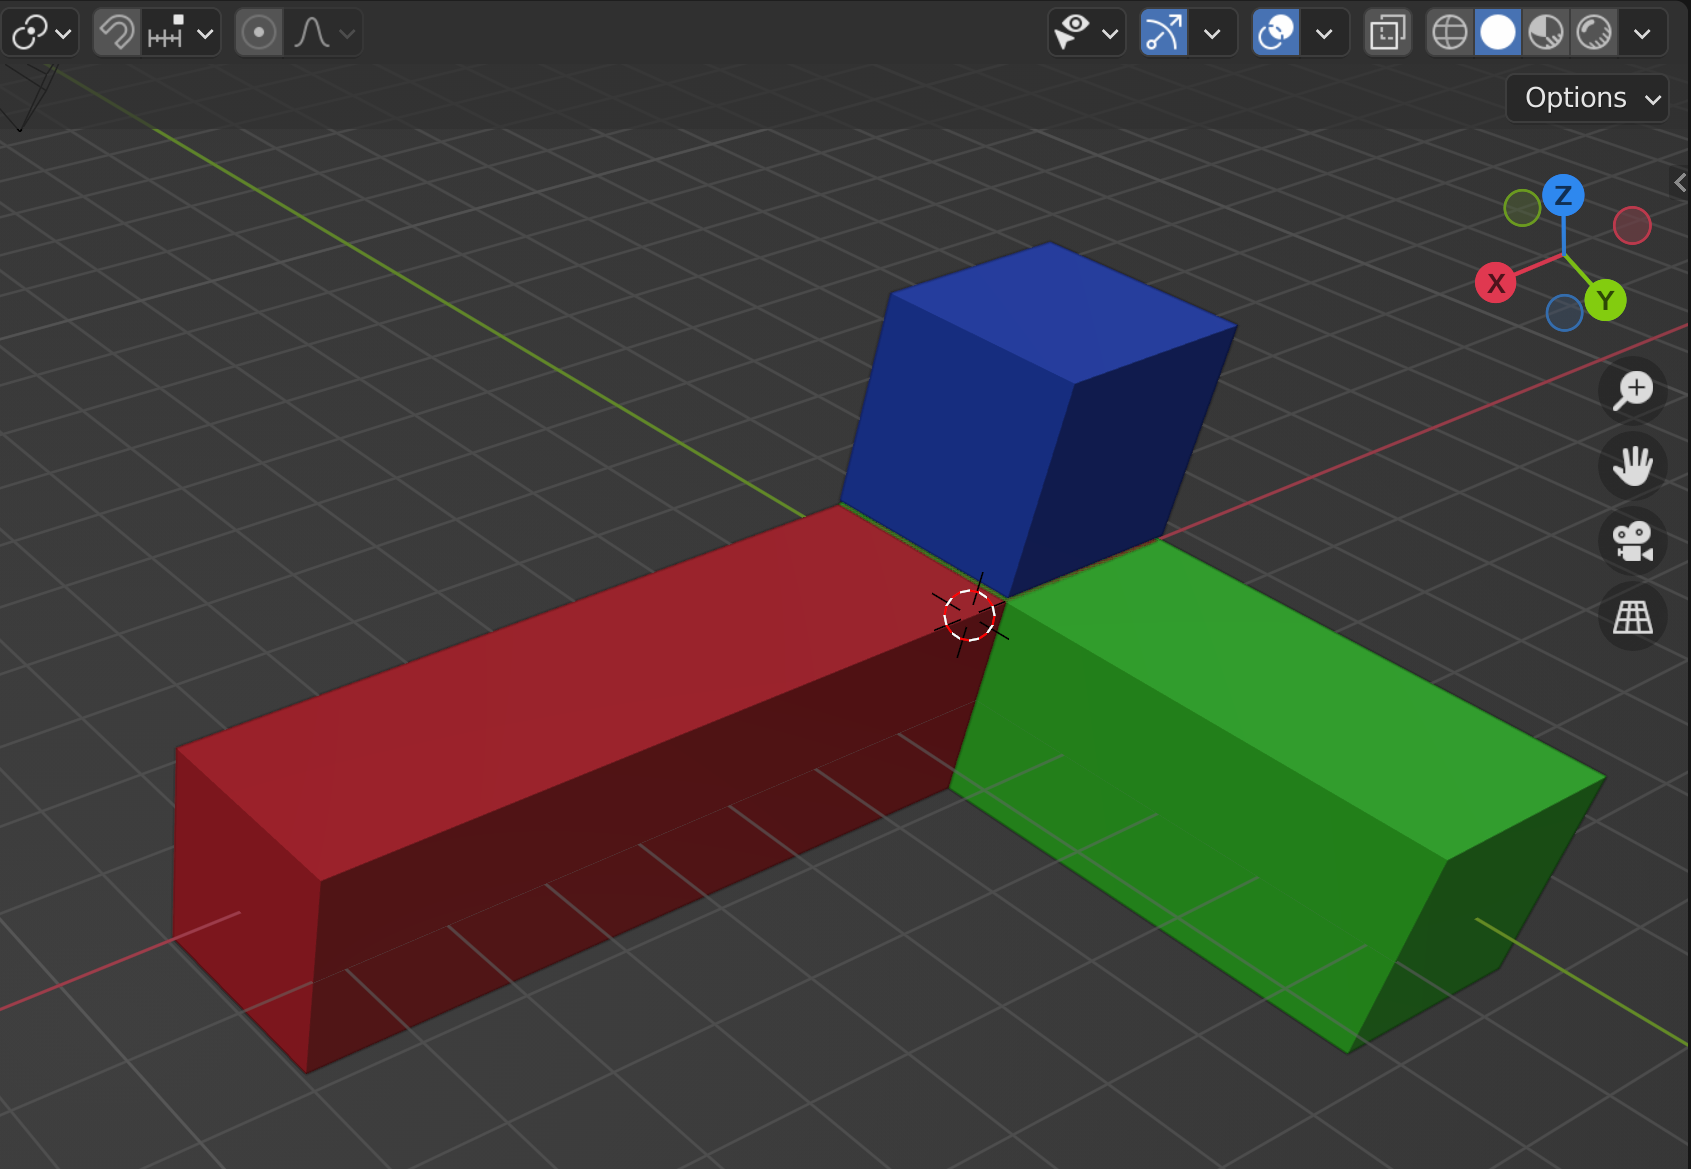
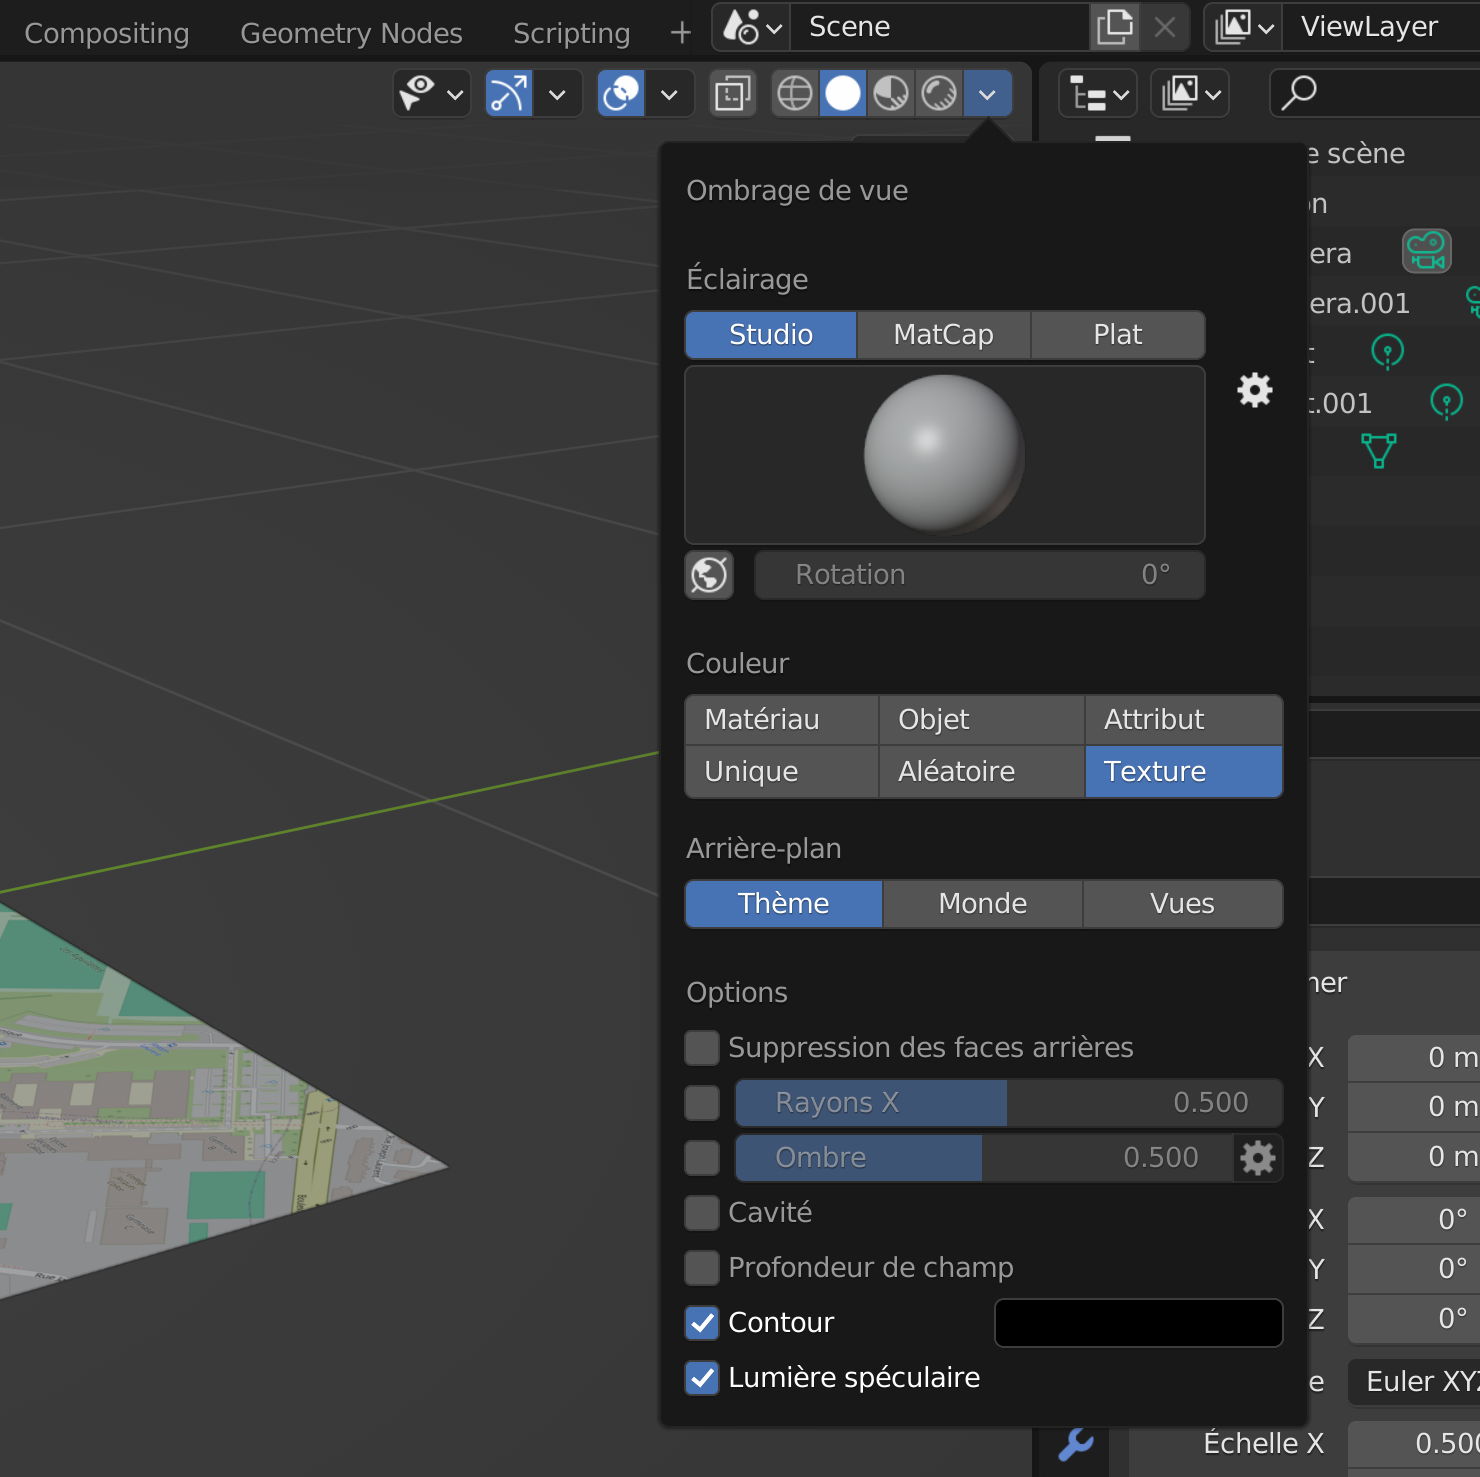
3D representation of the axes in Blender, enabling correspondence with RViz2.